
Roughly 95% of people in American prisons come home. The question was never whether they return to our communities. It is what version of them arrives.
CORNERSTONE turns the time between sentencing and release into the thing it should always have been: a period of structured training that produces a person with a credential, a job offer, treated clinical need, and a verifiable record — instead of a person with a release date and nothing else.
The floor comes first
Everything downstream assumes a building where a person can breathe. That assumption does not currently hold. A rehabilitation framework that opens with college programs while people are getting sick in the same building will be read as unserious, and it will deserve to be.
Two structural failures sit underneath all of it: in a number of states, correctional facilities are wholly or partly exempt from the routine public health inspection that governs restaurants, schools, and nursing homes — and roughly half of states have no corrections ombudsman or independent oversight body with real access.
Five parts
Download the framework document (Markdown, v1.0 — July 2026)
The five applications
Each one runs entirely in the browser as a single self-contained file. No login, no server, no install. A family member on a phone in a parking lot outside a facility should not need an account, and a public defender's office should not need IT approval to open a web page.


What it returns
Everyone quotes four to five dollars back per dollar spent. That figure is real, it is RAND's, and it is narrow — it counts reincarceration cost avoided over three years, to taxpayers, and nothing else. No earnings. No taxes paid. No crime that never happened to anybody.
Count the whole life and the number moves a long way.
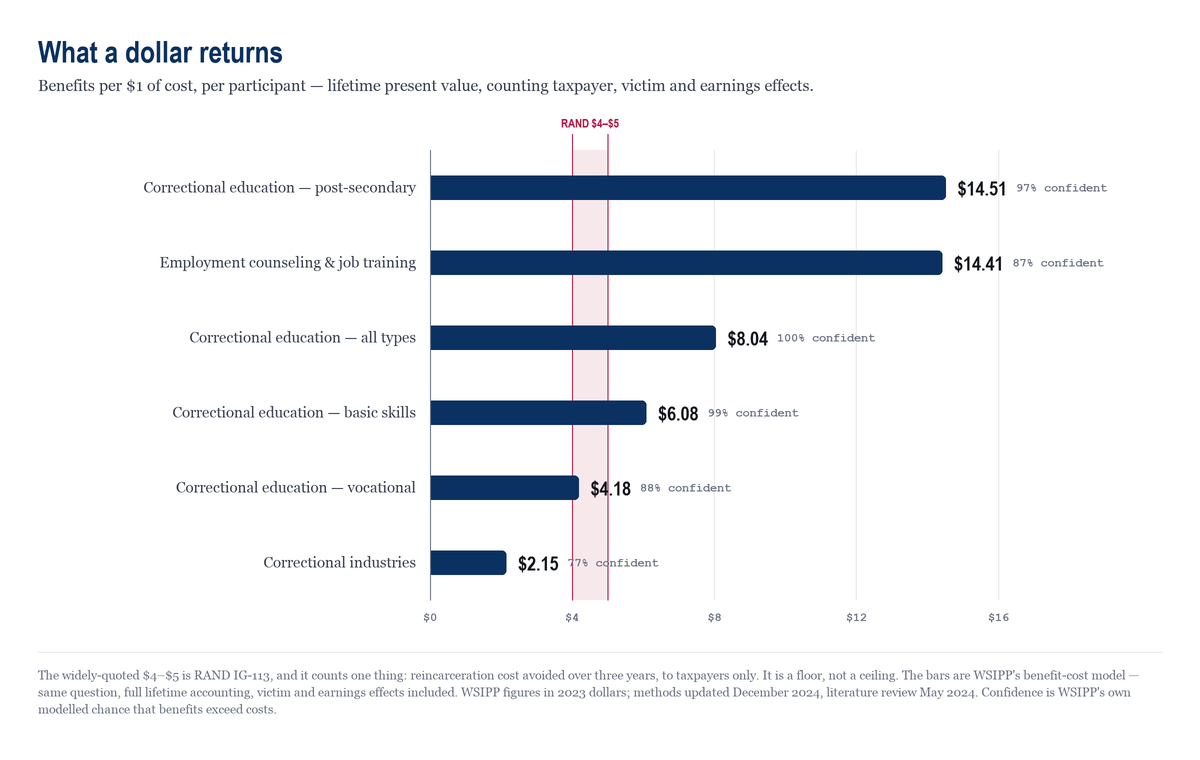
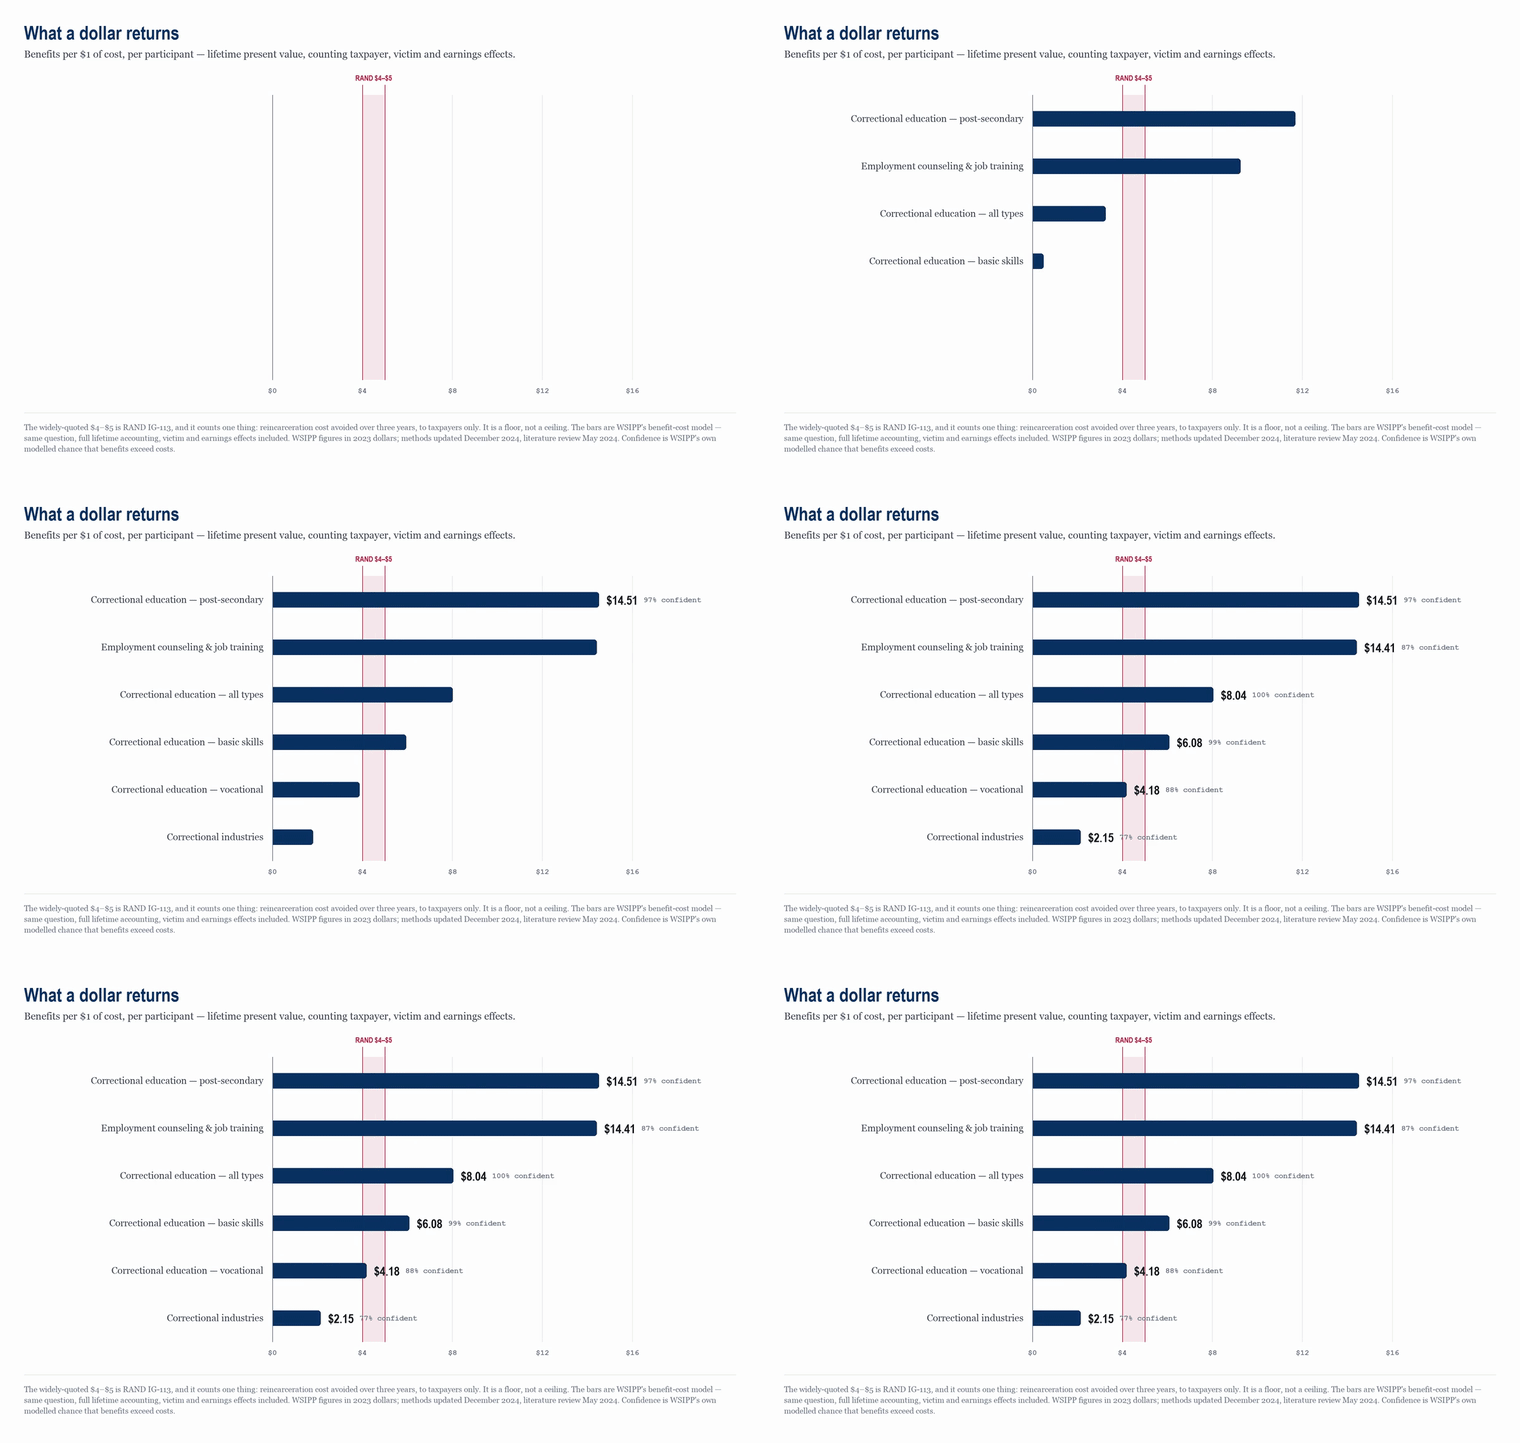
Sources: RAND IG-113 / RR-266 / RR-564, correctional education meta-analysis. Washington State Institute for Public Policy benefit-cost results, adult criminal justice — figures in 2023 dollars, benefit-cost methods updated December 2024, literature review May 2024; "confident" is WSIPP's own modelled probability that benefits exceed costs. Both are VERIFIED against the publishing body.
Watch how to use them
Every one of these is a narrated walkthrough of the real app — recorded off the live page, not a mockup — with captions. If a video shows a screen the app no longer has, the video is wrong and we want to know.
How to read what these apps tell you
Every factual cell across the suite says one of three things about itself: verified (checked against a primary source), likely (follows a known pattern or a secondary source — confirm before relying on it), or unverified (recorded but not yet checked). Only verified cells count toward a grade. Gaps are displayed rather than filled in. The coverage bar is a feature: it is what makes the grid trustworthy the first time someone checks a cell.